
The following table contains the best information we have available about the cars in GPL. Dimensions and weights come from GPL's menus. Weight distributions were extracted from an early beta version of GPL.
Ride heights are from Ricardo Nunnini's GPL Foolishness. Note that GPL adjusts for spring rates and fuel loads so that the ride height when the car enters the pits will be as specified on the Car Setup meu. Ricardo says, "The Chassis Ride Heights are those that keep the driveshafts parallel with the ground as seen by a ground-level camera looking at the rear suspension. The AI use the same ride height at each circuit. The values are approximate."
Ricardo also calculated the Track/Wheelbase Ratio. He says, "Received wisdom has it that long slim cars (those with a larger track/wheelbase ratio) tend towards improved stability at high speeds and are less inclined to dart about. Short, wider cars are not supposed to be as fast in a straight line, are more twitchy but consequentaly are more sensitive and responsive on a tight course." My experience with GPL's cars certainly bears out this thinking, with the possible exception of the Brabham - and there are good reasons for that.
None of this information can be guaranteed to be dead accurate, but it's the best we're likely to get. Empirical evidence suggests that it is pretty close.
|
Weight |
% on Rear |
Wheel- |
Front Track |
Rear Track |
Track/ |
Chassis |
AI Ride |
|
|---|---|---|---|---|---|---|---|---|
|
Brabham |
1105 | 58 | 93.5 | 53.0 | 55.5 | 1.72:1 | 4.00 | 3.50 |
|
BRM |
1381 | 64 | 94.0 | 58.8 | 60.0 | 1.58:1 | 4.50 | 3.00 |
|
Coventry |
1231 | 60 | 98.0 | 59.5 | 59.5 | 1.64:1 | 3.75 | 3.25 |
|
Eagle |
1165 | 61 | 96.5 | 60.0 | 60.0 | 1.61:1 | 3.75 | 2.75 |
|
Ferrari |
1129 | 61 | 94.5 | 59.5 | 59.8 | 1.58:1 | 3.75 | 3.00 |
|
Lotus |
1105 | 62 | 95.0 | 60.0 | 60.0 | 1.58:1 | 3.75 | 3.25 |
|
Murasama |
1313 | 64 | 96.0 | 59.5 | 59.5 | 1.61:1 | 3.00 | 2.75 |
The following tables can serve as a rule of thumb for which way to go with damper settings to adjust the car's transient behavior in the corner entry phase (Phase 1, braking and turning) and corner exit phase (Phase 3, acceleration).
These settings have most impact in the entry and exit phases, but also have an effect during Phase 2 if the driver applies power or lifts off the power and/or applies some brake to adjust the car's attitude and direction.
|
|
|
||||||||||||||||||
|
|
||||||||||||||||||
|
|
|
|
|
||||||||||||||||||
|
|
||||||||||||||||||
|
|
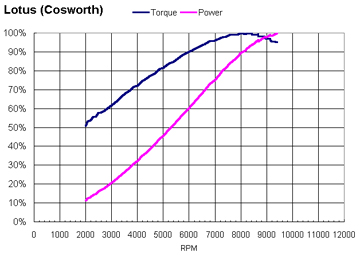
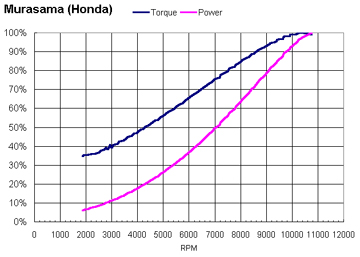
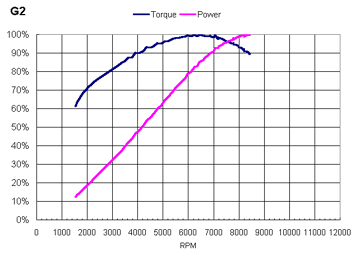
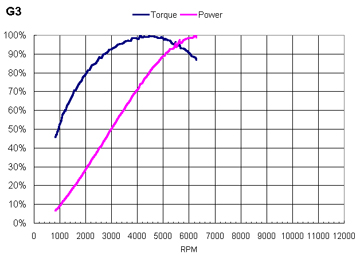
The tables below contain the best information we have available about the engines in GPL. Grand Prix engine power and redlines come from GPL's menus; Trainer numbers come from various sources.
|
|
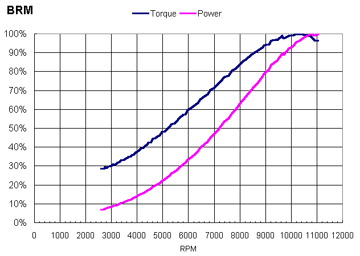
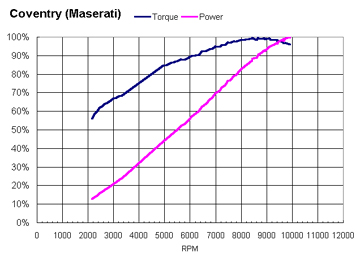
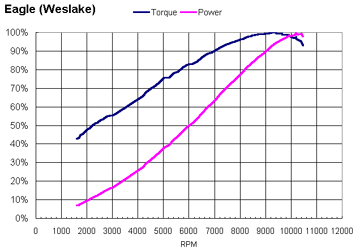
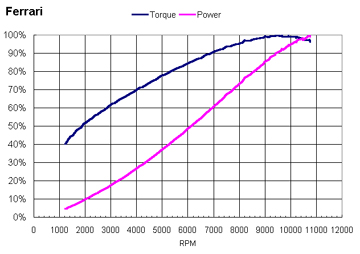
The following charts show engine torque and horsepower of each of the engines in GPL. The curves are shown as a percentage of the peak. These tables were generated from RPM data extracted from replays of the cars accelerating from rest on a level surface in a single gear. Torque and power are calculated based on the change in velocity between each frame.
|
|
|
|
|
|
|
|
|
|
|
|
|
|
|
 Prior
to the development of GRE, Ricardo Nunnini performed coastdown
testing and found very little aerodynamic drag (see References).
I discussed this apparent lack of aerodynamic drag with Dave Kaemmer,
who wrote GPL's physics model. He said that GPL definitely does
model aerodynamic drag, and that each chassis is quite different.
Prior
to the development of GRE, Ricardo Nunnini performed coastdown
testing and found very little aerodynamic drag (see References).
I discussed this apparent lack of aerodynamic drag with Dave Kaemmer,
who wrote GPL's physics model. He said that GPL definitely does
model aerodynamic drag, and that each chassis is quite different.
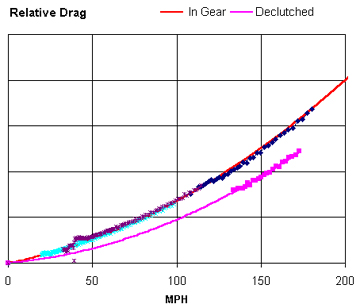
We ran tests in which we allowed various cars to coast down from high speeds. We saved replays and extracted velocity data using a special feature in GPL Replay Analyser.
The chart at the right shows the data we derived from this testing, converted to a dimensionless "relative drag."
The red line is a binomial curve-fit to the "In Gear" data. The upward curvature is indicative of the aerodynamic portion of drag. The magenta points and curve are for a coastdown with the clutch in.
When we derived the torque and power curves for GRE, we included a compensation term derived from the red 2nd order curve.
| Top Speed at | |||
|---|---|---|---|
|
Lap |
Masta |
Blanch- |
|
|
BRM |
3:41.84 | 171 | 159 |
|
Coventry |
3:40.70 | 170 | 160 |
|
Murasama |
3:40.57 | 172 | 160 |
|
Ferrari |
3:38.10 | 172 | 162 |
|
Lotus |
3:37.17 | 173 | 163 |
|
Eagle |
3:36.38 | 175 | 164 |
|
Brabham |
3:34.46 | 178 | 168 |
Chub Pearson measured top speeds for the various Advanced Trainers, which each have chassis identical to their respective GP cars but which all use exactly the same engine.
Note that the Masta Straight is slightly downhill, so the top speeds there are mostly a function of aerodynamic drag, while the straight leading up to Blanchimont is uphill, so weight is much more of a factor in these numbers.
From these numbers, it seems reasonable to conclude that the Coventry has more aerodynamic drag than the heavier Murasama and BRM. It also seems clear that the Brabham has considerably less aerodynamic drag than the other cars, even the Lotus, which weighs the same as the Brabham. The Eagle has less drag than the Lotus, which it outweighs. The Ferrari seems to have the most drag of the four lightweight cars, even though the Eagle is heavier.
The following table shows angle of banking and length of each of the conversion ovals. Data is from the various Papyrus NASCAR manuals.
|
Length |
Turn 1 |
Turn 2 |
Turn 3 |
Turn 4 |
|
|---|---|---|---|---|---|
|
Atlanta |
1.54 | 24 | 24 | 24 | 24 |
|
Bristol |
.533 | 36 | 36 | 36 | 36 |
|
California |
2 | 14 | 14 | 14 | 14 |
|
Charlotte |
1.5 | 24 | 24 | 24 | 24 |
|
Darlington |
1.366 | 25 | 25 | 23 | 23 |
|
Gateway |
1.25 | 11 | 11 | 9 | 9 |
|
Hickory |
.363 | 12 | 12 | 14 | 14 |
|
Homestead |
1.5 | 6 | 6 | 6 | 6 |
|
Loudon |
1.058 | 12 | 12 | 12 | 12 |
|
Indianapolis |
2.5 | 9 | 9 | 9 | 9 |
|
Michigan |
2 | 18 | 18 | 18 | 18 |
|
Mesa Marin |
1.5 | 17 | 17 | 17 | 17 |
|
Milwaukee |
1 | 9.25 | 9.25 | 9.25 | 9.25 |
|
Phoenix |
1 | 11 | 11 | 9 | 9 |
|
Pikes Peak |
1 | 10 | 10 | 10 | 10 |
|
Pocono |
2.5 | 14 | 8 | 6 | |
|
Talladega |
2.66 | 33 | 33 | 33 | 33 |
|
Texas |
1.5 | 24 | 24 | 24 | 24 |